


Automated GA4 reporting means the pull, the commentary and the delivery all happen without you. Most teams automate only the pull, which is the cheapest third of the job. The expensive part is the writing and the formatting, and that is now automatable too.
Before the how, the arithmetic - because this decision is usually justified on time and almost never actually costed.
How long manual GA4 reporting actually takes
Do not take a survey number for this. Time your own next report, in four parts, because the split determines what to automate first:
| Stage | Typical range per client | Automatable? |
|---|---|---|
| Pulling and assembling data | 20-45 min | Fully |
| Checking it looks right | 10-20 min | Partly |
| Writing the commentary | 30-90 min | Mostly |
| Formatting and sending | 10-30 min | Fully |
Run your own numbers through this: (minutes per report x reports per month x hourly cost) = monthly cost of reporting. An agency doing twelve monthly client reports at ninety minutes each is spending eighteen hours a month producing documents whose structure never changes. That is the number to compare against, not a vendor's "save 8 hours a week" claim.
Note where the time actually sits. Most teams automate the data pull, which is the smallest slice, and keep doing the writing by hand. The commentary is the expensive part.
What parts of GA4 reporting can be automated
- The pull. Metrics, dimensions, date ranges, comparison periods. Deterministic and fully automatable.
- The sanity check. Flag suspicious values before a human sees them: zero rows, a metric that moved more than a threshold, a channel that vanished. Rules, not judgement.
- The commentary. "Organic sessions rose 12% while conversions fell 4%, driven by two landing pages." An agent with the data can write this, and it is the largest time saving available.
- The file. Generating an actual xlsx, docx or pdf rather than a link to a dashboard.
- Delivery. Scheduled send to a fixed recipient list.
What stays human: the strategic recommendation at the end, and the decision about what to do when a number is bad. An agent can say conversions fell. It cannot decide whether to tell the client that this is a problem with their landing page or with your campaign.
How to automate GA4 reporting
Three layers, and you can stop after any of them.
Layer 1: scheduled dashboards
Looker Studio on a schedule. Solves the pull and the delivery. Leaves the commentary entirely with you, which as established is where most of the time goes. Free, and worth having regardless.
Layer 2: scripted export
A script hits the GA4 Data API, writes to Sheets or a database, and a template renders it. More control, more maintenance, still no commentary. If you are building this now, note that Google publishes its own Google Analytics MCP server exposing run_report, run_funnel_report and run_realtime_report - it authenticates with Application Default Credentials on the read-only Analytics scope and saves you writing the client layer, though Google labels it experimental.
Layer 3: a scheduled agent run
An agent pulls the data, writes the commentary, generates the file and emails it. This is the layer that removes the ninety minutes rather than the twenty. It is also the layer with real failure modes, which the next section covers honestly.
The instruction for layer 3 is a report specification, not a request. Ours looks like this:
Produce the monthly organic performance report for [domain], [month].
Structure:
1. One-paragraph verdict.
2. Table: sessions, conversions, revenue, with month-over-month
   and year-over-year change.
3. The three largest movements, each with a stated cause.
4. Anything that needs a human decision, flagged.
Every figure must come from the connected GA4 property.
Where a figure is unavailable, write "not available" - never estimate.
State the metric, dimension and date range behind each number.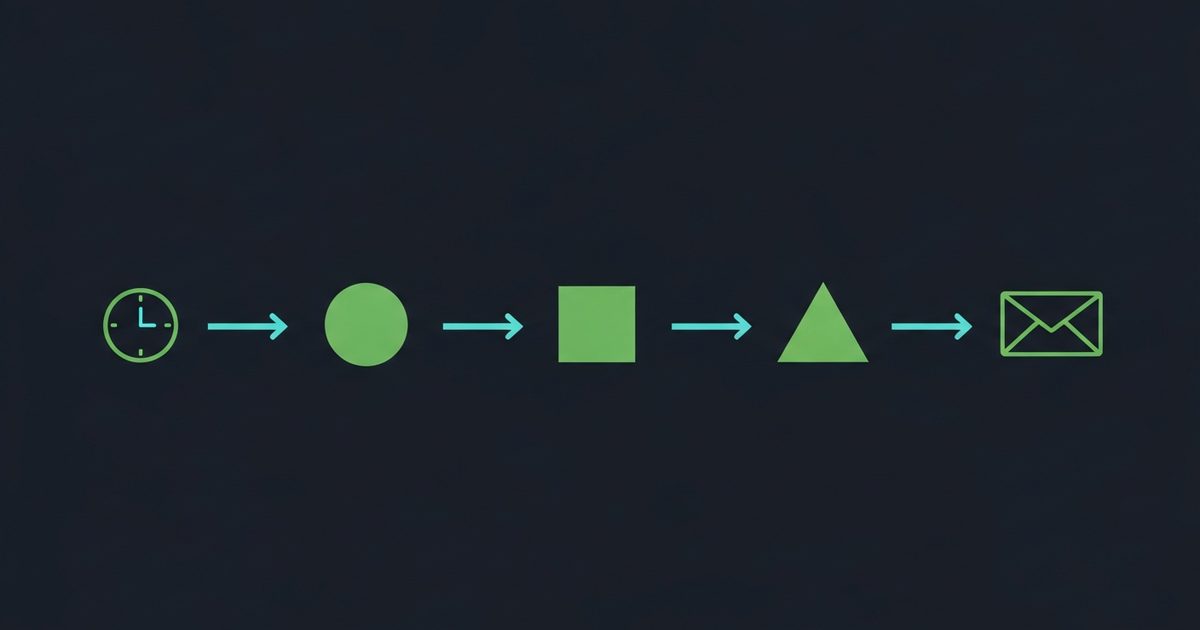
How to schedule an automated GA4 report
Scheduling sounds like the easy part and is where most home-built systems break. Five things have to be true, and we learned each of them the hard way building our own workflow engine.
The schedule must be timezone-aware. A report set for 9am should arrive at 9am for the recipient, not 9am UTC. We interpret the configured hour in the workflow's own timezone.
Two workers must not be able to run the same schedule twice. Our scheduler claims a run by compare-and-swap on the next-run timestamp - the write that moves the schedule forward is the claim - so two processes can never both fire the same tick and double-charge for it.
A late run must be skipped, not replayed. If the scheduler was down and a run is more than six hours late, sending it is worse than not sending it: the client gets Monday's report on Wednesday labelled as Monday's. We skip rather than catch up.
A crashed run must not wedge the schedule. A run that dies mid-flight leaves the workflow marked running forever unless something sweeps it. Ours fails off anything stuck for thirty minutes so the next tick can proceed.
Steps need a timeout. An agent step that hangs on a slow API should fail with a useful message rather than blocking the queue. Ours caps each step at ten minutes.
None of this is glamorous, and all of it is the difference between a reporting system you trust and one you check every Monday to see whether it ran.
What can go wrong with automated GA4 reports
The blank report. The template asks for the commentary, the agent produced nothing, and the client receives an email containing the literal word "undefined". Guard explicitly: if the agent produced no text, the message should say so rather than send empty.
Quota exhaustion. Per Google's Data API quota documentation, a standard property gets 200,000 core tokens per property per day and 10 concurrent core requests, and request complexity drives consumption. Twenty client reports firing at 9am on the first of the month against complex queries will fail some of them. Stagger the schedule.
Retention gaps in year-over-year comparisons. Google's data retention settings hold user-level and event-level data for 2 or 14 months on standard properties, and the setting affects explorations and funnel reports rather than standard aggregated reports. A year-over-year funnel comparison on a property left at the 2-month default has no data to compare against, and the report should say so instead of showing zero.
Silent metric drift. Someone reconfigures a key event and the conversion number changes definition mid-series. The report keeps producing a number; it is just no longer the same number.
Attachment limits. Generated files grow. Ours caps at 8MB per file, 15MB per message and six files, and anything over that is delivered as a download link instead of failing the send.
Sending to the wrong people. An automated system that can email arbitrary addresses on a schedule is a liability. We require every recipient to confirm their address by clicking a verification link first, with the account holder's own address the only one trusted on sight.
How to keep automated reports consistent month to month
This is the objection agencies raise first and they are right to. An agent given the same instruction twice may take a different route and produce a differently-shaped document, and a client cannot compare March against April if the structure moved.
The fix is to split determinism from judgement. Assemble the numbers deterministically - fixed metrics, fixed dimensions, fixed comparison periods, fixed table order. Let the agent write only the prose, inside a structure you specified. The variation then lands in the sentences, where it is a feature, and never in the layout, where it is a defect.
Two supporting habits: pin the report specification in version control and change it deliberately, and pass no conversation history between scheduled runs. That second one is deliberate in our engine - every run of a scheduled workflow starts clean. Replaying history grows the prompt, the latency and the token bill on every run, and invites the agent to write "as we discussed last month" into a client document.
Scheduled dashboard or automated report?
They solve different problems and teams routinely buy one expecting the other.
| Scheduled dashboard | Automated report | |
|---|---|---|
| Answers | What happened | What happened and why |
| Commentary | None - you write it | Generated |
| Output | A link to a live view | A file you can attach or archive |
| Reads at a point in time | No - it keeps changing | Yes - it is a snapshot |
| Cost | Free | Per run and per query |
| Best for | Ongoing monitoring | Recurring client deliverables |
The row that decides it for agencies is "reads at a point in time". A dashboard link sent in March shows April's data in April, so it cannot be referenced in a conversation about March and it cannot be archived as a record of what was reported. A generated file can. That is why dashboards do not actually replace client reports even when they contain every number the report contains.
The two are complements. Keep the dashboard for the standing view your team watches, and generate a file for anything a client receives on a schedule. And when the dashboard shows something you cannot explain, that is an agent question rather than a reporting question - covered in using an AI agent for GA4.
Can AI write the commentary?
Usefully, yes, within limits. It is reliably good at describing what changed, quantifying it, and attributing it to the segment carrying the movement. It is unreliable at causation beyond the data - it cannot know you paused a campaign or that a competitor launched - and it will confidently propose a cause anyway unless instructed otherwise.
The instruction that fixes this: state what changed and the evidence; where the cause is not visible in the data, say the cause is not determinable from the available data. That single line converts the weakest part of AI commentary into its most credible.
What automated GA4 reporting costs
Two components, and one of them is not money. In credits: our workflow engine charges a flat 25 per scheduled run before any step executes, 5 per email sent (refunded if the mail server rejects it), plus the normal agent rate for the analysis itself - 50 credits per GA4 query and 300 credits per million model tokens.
The other cost is API quota, which you cannot buy more of on a standard property. A report pulling six dimensions across two comparison periods is meaningfully more expensive in quota than one pulling three, so report specifications should be as narrow as the deliverable allows. Precision is cheaper twice over.
Should agencies automate client reporting?
Yes, with the boundary in the right place. Automate assembly, commentary drafting and delivery. Keep the recommendation and the client conversation human, and read every report before it goes out for at least the first quarter - not forever, but until you have seen how the system behaves when a number is genuinely strange.
The gain is not that reports get written faster. It is that the eighteen hours a month move from assembling documents to the work clients actually pay for.
For the analysis side of the same connection, see using an AI agent for GA4. Autopilot runs the scheduled workflow described here, including the file generation and verified-recipient delivery.
Frequently Asked Questions
How long does manual GA4 reporting actually take?▾
What parts of GA4 reporting can be automated?▾
How do you schedule an automated GA4 report reliably?▾
What can go wrong with automated GA4 reports?▾
How do you keep automated reports consistent month to month?▾
Can AI write the commentary in a GA4 report?▾
Should agencies automate client reporting?▾
Get a Free AI Ranking Consultation
Want to improve your brand's visibility in AI search engines like ChatGPT, Gemini, and Perplexity? Fill out the form and our experts will create a personalized strategy for you.

Written by
Devanshu
Chief Marketing Officer & AI Search Optimization Architect
Digital Marketing Strategist & Pioneer in SEO, Answer Engine Optimization (AEO), and Generative Engine Optimization (GEO).


