



A GEO experiment only proves something if it compares changed pages against unchanged control pages, measures each prompt many times before and after the change, and decides in advance what size of difference counts. AI answers move on their own: across 972 repeated runs of 42 prompt-engine pairs tracked in AI Rank Lab (February to October 2026), 42.9% of pairs flipped between mentioning and not mentioning the brand at least once, with nobody touching anything. A test that skips the control or the repeats is measuring that noise.
This guide turns those variance numbers into a working method: how to write the hypothesis, choose the unit and the control group, size the prompt set, set the test window, read the result and avoid fooling yourself. It borrows the rigor SEO split testing has used for years, and it ends with a worked plan and a list of experiments worth running, with the published results attributed to the teams that ran them.
Key takeaways
- Noise is the baseline, not the exception. In our data, the median overlap of cited domains between two consecutive runs of the same prompt was 0.41 (Jaccard), and only a median 3.4% of cited domains appeared in every run.
- Most published GEO experiments are n=1 or close to it. One test page, one control page, or 10 test pages against 2 controls cannot separate a real effect from normal drift.
- Prompts beat repeats. Once each prompt has about five runs per period, more prompts reduce error far more than more runs of the same prompt.
- Screen out prompts that cannot move. 24 of our 42 pairs never changed mention status (19 always mentioned, 5 never), so they would add no signal to a mention-rate test.
- Fix the metric, the effect size and the end date before launch, read results per engine, and check whether one page carries the whole result.
- Measure the business outcome too. SearchPilot reports a change that lifted LLM traffic but would likely have cut Google organic sessions by about 6.5%.
What is a GEO experiment?
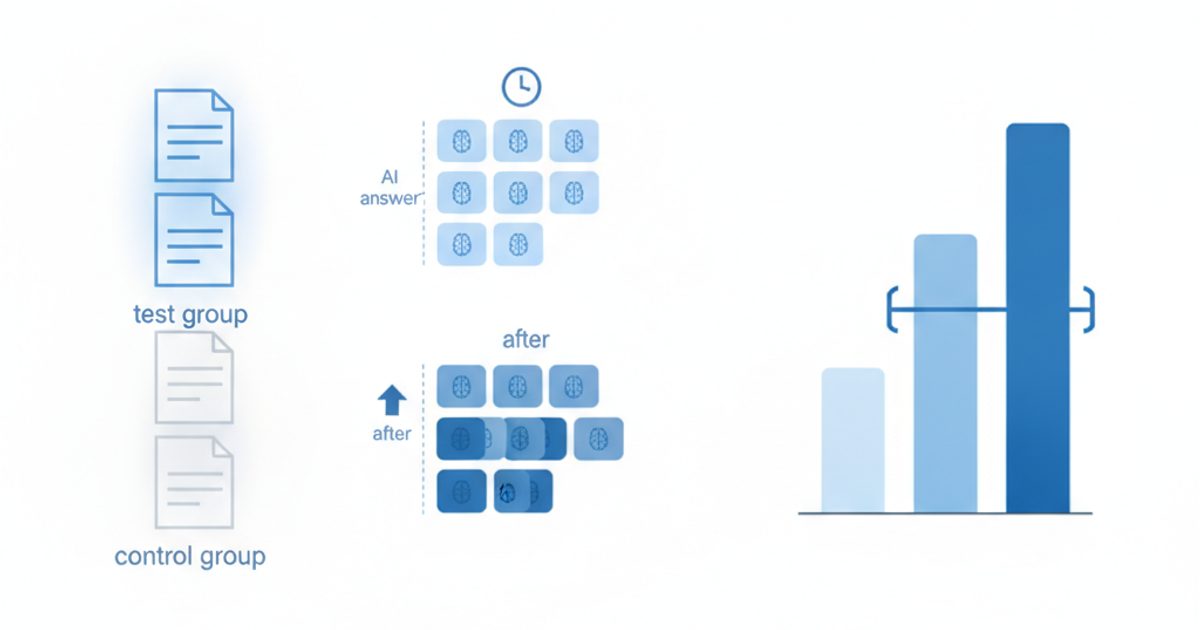
A GEO experiment is a controlled test of whether a specific change to your content, site or off-site presence changes how often AI answer engines (ChatGPT, Claude, Gemini, Perplexity, Google AI Overviews and AI Mode) mention your brand or cite your URLs. The change is applied to a test group, a similar control group is left alone, both are measured repeatedly over the same period, and the difference between the two groups is the estimated effect.
The term comes from a 2023 paper by researchers at Princeton and partner institutions. Aggarwal et al. (KDD 2024) tested nine content rewriting methods on a benchmark of queries and reported visibility gains of up to 40% in generative engine responses, while noting that what works varies by domain. That was a lab benchmark with a fixed setup. The experiments marketers run today are messier: live engines, changing models, personalized answers and small page sets. That is why method matters more than the tactic being tested.
Why most published GEO experiments can't be trusted
Most published GEO experiments fail in one of three ways: too few units (one page, or a handful), no real control group, or a single measurement where many are needed. The teams publishing them are often candid about this. The problem is that the headline number travels and the caveats don't.
Here is what the better-known recent experiments actually tested, using the numbers each publisher reported (all checked October 2026):
| Experiment (publisher) | Change tested | Test units vs control | Window | Headline | What it can't show |
|---|---|---|---|---|---|
| Publication date update (Otterly, Sep 2026) | Only the visible "last updated" date | 10 articles vs 2 controls, 320 prompts, 7 engines | 30 days before vs 30 days after | Citations +31.5% (4,800 to 6,312); controls -10.6% | Authors call it "directional rather than conclusive"; citations were already trending up; AI Mode fell 20% and Gemini 37% while other engines rose |
| Year in title (Otterly, Jul 2026) | Added "2026" to title tag and H1 | 11 pages vs 3 unmatched reference pages | 15 days before vs 15 days after | Citations +61% in one group | An untouched reference page rose 63-64%; 86% of the net gain came from one URL; the author calls it inconclusive |
| Key takeaways section (Peec, OnBoard case, Oct 2026) | Key takeaways block plus schema | 1 page vs 1 control | 6 weeks, 3 checkpoints | Citation rate 1.45 to 2.33 (control 1.61 to 1.72) | n=1 per arm; two changes bundled; control retrieval swung 36, 136, 177, 92; test-page visibility fell from 22% to 9% |
| Exact-match directory site (Peec, Bricx case, Oct 2026) | New directory on an exact-match domain | 1 domain, no control | 67 days | Cited for head-term prompts within weeks | Retrieved in 38.6% of answers for the head term but under 5% for buyer-style prompts; 91% of retrievals from ChatGPT |
| 72-hour citation test (groas, Sep 2026) | 90-140 word direct-answer block | 1 page vs 1 control, 1 query each | 72 hours | Method write-up | The author says a control cannot prove the rewrite caused a citation; no repeat-run threshold |
None of these is worthless. Otterly's publication-date test, with 320 prompts and a stated pre and post window, is better designed than most. The OnBoard team fixed its metric before starting, which is exactly right. Peec's Metehan Yesilyurt gave the best one-line summary of the whole field: "Don't copy the tactic, copy the setup." But read the "what it can't show" column before you copy any of these tactics, because in the year-in-title test an untouched page moved as much as the edited ones. That is what noise looks like.
How much do AI answers vary between runs of the same prompt?
A lot, and differently per engine. We used AI Rank Lab's own tracking data as the noise baseline for this guide. Method: successful runs between 2026-02-13 and 2026-10-22, limited to prompt-engine pairs with at least 5 successful runs, giving 42 pairs and 972 runs. Jaccard is the overlap of cited domains between consecutive runs (1.0 means identical sources, 0 means none shared). The full study, with its limitations, is in our AI answer stability study (which used runs through October 14; the figures here are refreshed through October 22). Here we use it to design tests.
| Engine | Pairs (runs) | Pairs that flipped mention at least once | Median consecutive-run Jaccard (cited domains) | Median % of cited domains present in every run |
|---|---|---|---|---|
| All engines | 42 (972) | 42.9% (18 of 42) | 0.41 | 3.4% |
| Gemini | 13 (275) | 23.1% | 0.26 | 2.1% |
| ChatGPT | 11 (240) | 54.5% | 0.54 | 7.7% |
| Claude | 11 (227) | 45.5% | 0.53 | 10% |
| Perplexity | 6 (224) | 66.7% | 0.59 | 3.8% |
Google AI Overviews had a single qualifying pair with 6 runs, too few to report. Perplexity's 6 pairs are also a small sample. Treat the per-engine rows as directional.
These numbers line up with independent research. Schulte, Bleeker and Kaufmann (University of St. Gallen, April 2026) collected answers daily for 45-46 days across ChatGPT, Gemini, Google AI Mode and Perplexity and found mean day-to-day source Jaccard of 0.336 to 0.423 per campaign, roughly 65% source turnover from one day to the next. They describe source instability as "a persistent property of the generative search process" and conclude that visibility should be measured as a distribution, not a single snapshot. The SparkToro and Gumshoe study (2,961 prompts, January 2026, not peer reviewed, run with a tracking vendor) found less than a 1-in-100 chance that ChatGPT or Google's AI returned the same brand list twice.
Three design consequences follow from this:
- Brand mention is a steadier outcome than citation. With only about 3% of cited domains present in every run, "was my URL cited?" on any single run is close to a coin toss for most pages. Citation tests need more runs than mention tests.
- Engines need separate baselines. Gemini had the steadiest mentions in our data but the least stable sources; Perplexity was the reverse. Pooling them hides opposite behavior, which is also what Otterly saw when AI Mode and Gemini fell while other engines rose.
- Before-and-after without a control is uninterpretable. If close to half the pairs flip on their own, a flip after your change is not evidence.
How is a GEO experiment different from an SEO split test?
The logic is the same and the measurement is different. SEO split testing, as practiced by SearchPilot for years, splits a set of similar pages into control and variant groups, changes only the variant, runs both at the same time and estimates the effect against a forecast built from the control. SearchPilot's own methodology write-up (Will Critchlow, July 2026) makes two points that transfer directly: both groups run concurrently so they share external conditions, and results should be reported as an interval, because significance alone "does not tell you how precise the estimate is". It also names false positives as "the most commercially damaging error".
| SEO split test | GEO experiment | |
|---|---|---|
| Unit randomized | Pages (not users) | Pages, or page-prompt pairs |
| Outcome data | Organic sessions or clicks, measured continuously | Sampled answers: you only see the runs you pay for |
| Noise source | Seasonality, page-level traffic swings | Those plus answer randomness, model updates, retrieval changes |
| Typical sample | Hundreds or thousands of template pages | Usually tens of pages and tens to hundreds of prompts |
| Platforms | One (Google) | Four to six engines that can respond in opposite directions |
| Main trap | Bad bucketing, peeking | No control, single runs, pooled engines, one page carrying the result |
SearchPilot also argues that prompt tracking alone is "being asked to do too much". In Is GEO Working? (August 2026) Critchlow describes an Omio test where a structured key-takeaways change improved LLM-driven traffic but would likely have reduced Google organic sessions by about 6.5%, so it was not rolled out, while a brand USP module lifted LLM traffic by 18%. The lesson for GEO testers: measure at least one business outcome next to the prompt metrics.
How to design a GEO experiment, step by step
The short version: one change, a matched control group, a prompt set screened for prompts that can move, a fixed metric and window, and repeated measurement on both sides of the change. In order:
- Write a falsifiable hypothesis. "If we add a sourced 40-60 word answer under each H2 on comparison pages, their citation rate on Perplexity and ChatGPT will rise by at least X points versus control within six weeks." Name the change, the pages, the engines, the metric, the minimum effect and the window.
- Choose the unit. For on-page changes the unit is the page (and the prompts mapped to it). For off-site changes such as PR or Reddit, the unit is a topic cluster of prompts, because you cannot hold a "control" page constant.
- Build a matched control group. Split candidate pages into test and control with similar template, topic, baseline citation rate and traffic. Alternate assignment down a sorted list (1st to test, 2nd to control, and so on), or randomize within matched pairs.
- Map and screen prompts. Give each page 2-5 prompts a real buyer would ask. Then run a baseline and drop prompts at a ceiling or floor (see below).
- Set the measurement plan. Engines, runs per prompt per week, baseline length, washout period, test length. Write it down before launch.
- Run the baseline for 2-4 weeks with no changes to either group.
- Ship the change to the test group only, on one day. Log the date. Change nothing else on either group, including templates and internal links.
- Measure on the same schedule for the same length of time as the baseline.
- Analyze once, at the planned end, using the decision rules further down.
To automate steps 4 to 8, AI Rank Lab's AI visibility tracking runs the prompts you choose on ChatGPT, Claude, Gemini, Perplexity, Google AI Overviews and AI Mode and stores every run, so baseline and test periods can be compared run by run. If you need help building the prompt set, our guide to prompt research covers it.
Should the test unit be a page or a prompt?
Use the page as the unit you assign to test or control, and the prompt-run as the unit you measure. Assigning prompts rather than pages breaks down because one page can be cited for many prompts, and a change to it leaks into every prompt it touches, including ones you labeled control. The exception is off-site work, where the honest design is a time-based comparison across topic clusters: change your presence for cluster A, leave cluster B alone, and compare.
How do you pick prompts that can actually move?
Drop prompts where your brand is mentioned in every baseline run or in none. A prompt at 100% cannot show an improvement in mention rate, and a prompt at 0% that never retrieves your page is unlikely to respond to an on-page tweak. In our data this screen matters: 19 of 42 prompt-engine pairs were mentioned in every run and 5 were never mentioned, so 24 of 42 (57%) would contribute nothing to a mention-rate test. The pattern differed by engine: 10 of 13 Gemini pairs were always mentioned, while 4 of 11 ChatGPT pairs never were. For mention tests, the useful prompts are the contested ones. For citation tests, prefer pages that are retrieved but rarely cited, which is also Yesilyurt's advice in the Peec case study.
How many prompts and runs do you need for a GEO experiment?
More than most teams use, and the number is driven by prompts more than by repeats. The table below shows the approximate minimum detectable effect (MDE) for a mention or citation rate, in percentage points, for a test-versus-control, before-versus-after comparison (difference-in-differences) at 95% confidence and 80% power. "Observations" means prompt runs per group per period, so 60 prompts run twice a week for 4 weeks gives 480.
| Observations per group per period | Example (prompts x runs) | MDE if baseline rate is 20% | MDE if baseline rate is 30% | MDE if baseline rate is 50% |
|---|---|---|---|---|
| 120 | 30 prompts x 4 runs | about 20 points | about 23 points | about 26 points |
| 240 | 30 prompts x 8 runs | about 14 points | about 17 points | about 18 points |
| 480 | 60 prompts x 8 runs | about 10 points | about 12 points | about 13 points |
| 960 | 120 prompts x 8 runs | about 7 points | about 8 points | about 9 points |
| 1,920 | 240 prompts x 8 runs | about 5 points | about 6 points | about 6 points |
How we got these: MDE is approximately 2.8 x the square root of 4 x p x (1 - p) / n, where p is the baseline rate, n is observations per cell, the 4 reflects the four cells of a difference-in-differences design, and 2.8 combines the 95% confidence and 80% power multipliers. Treat the table as a floor, not a promise. It assumes every run is independent, and runs of the same prompt are not: a prompt that tends to mention you keeps tending to. The real detectable effect is larger, which is why the examples spread observations across many prompts rather than piling runs onto a few.
Research supports that allocation. In a variance-components study of 12,933 brand answers across three models and eight languages, Żatuchin (July 2026) found that a repeat beyond the fifth reduced relative error variance by only about 0.0003, and that adding prompts, models and languages reduced it far more per query spent. The St. Gallen team behind Don't Measure Once recommends at least 7 runs per prompt per day for brand visibility monitoring and two to four weeks of rolling aggregation, with per-brand standard error falling to 0.053 at 21 days. Practical rules of thumb from both:
- About 5 to 8 runs per prompt per engine per period is enough to stabilize each prompt's rate. Spend the rest of the budget on more prompts.
- If you can only afford 30 prompts per group, test only big changes, because you will not detect anything smaller than about 15 to 25 points.
- Size per engine. If you want a result for Perplexity and for ChatGPT, each needs its own sample.
- A rate near 50% is the hardest to move detectably; that is a property of proportions, not of AI search.
This is also why SearchPilot's advice to "use bold hypotheses" applies even more to GEO. A small tweak needs a sample most teams cannot afford. A substantial change has a chance of clearing the noise.
How long should a GEO experiment run?
Plan on a 2-4 week baseline, a short washout after the change, and a test period as long as the baseline, so six to ten weeks in total. Both periods must be the same length and cover the same weekdays. The washout exists because engines need to re-fetch and re-index the changed page before it can affect answers, and that lag is not published and differs by engine, so do not count the first days after launch.
The published experiments span 72 hours (groas) to 15 days (Otterly's year-in-title test), 30 days (Otterly's publication-date test), six weeks (OnBoard) and 67 days (Bricx). The St. Gallen data suggests that anything under about 10 days of aggregation leaves per-brand error above 0.10, so very short tests mostly measure noise. In our tracking, the median span of a prompt-engine pair's run history was about 25 days for most engines, so our variance figures describe roughly month-long windows. Two warnings: do not stop early because the numbers look good (peeking inflates false positives), and log any known model or interface change during the window, because it hits test and control alike and can swamp your effect.
What should a GEO experiment measure?
Pick one primary metric before launch and report the others as secondary. For most on-page tests the primary metric should be citation rate or mention rate per engine; for business decisions, add AI referral traffic and Google organic traffic as guardrails.
| Metric | Definition | Noise level | Best for |
|---|---|---|---|
| Mention rate | Share of runs where the answer names your brand | Medium (42.9% of our pairs flipped at least once) | Off-site and brand-positioning tests |
| Citation rate (URL) | Share of runs that link a specific test URL | High (median 3.4% of cited domains present in every run) | On-page content and structure tests |
| Position | Rank of your brand in a list answer | Very high (SparkToro: same order under 0.1% of the time) | Secondary only; never a primary metric |
| Share of voice | Your mentions as a share of all brands' mentions | Depends on the competitor set | Competitive tests; see our AI share of voice formulas |
| AI referral sessions | Visits from chatgpt.com, perplexity.ai, gemini.google.com and similar | Low volume for most sites | Business guardrail |
| Google AI impressions | Search Console Generative AI report impressions per page | Low (first-party, continuous) | AI Overviews and AI Mode tests |
AI Rank Lab's AI bot tracking tag records AI assistant referrals and AI bot visits per page, which gives you the referral guardrail at the page level for test and control groups, and the GA4 integration covers the same from your analytics.
Can you measure Google AI Overviews and AI Mode in a GEO experiment?
Yes, and Google gives you the cleanest data of any engine. The Search Console Generative AI performance reports (announced June 3, 2026, rolled out to all sites worldwide by August 31, 2026) show impressions in AI features such as AI Overviews and AI Mode by page, country, device and date. They do not show queries or clicks for those features. For a test-versus-control design that is enough: sum AI-feature impressions for the test pages and the control pages, before and after, and compare. Because it is continuous first-party data rather than sampled runs, it is far less noisy than prompt tracking. Our walkthrough of the Search Console Generative AI report explains the filters.
A worked example: one GEO experiment plan
Here is a complete plan for a mid-sized B2B site testing whether answer-first sections with a sourced statistic raise citations on comparison pages. The numbers follow the sizing rules above.
| Element | Plan |
|---|---|
| Hypothesis | Adding a 40-60 word direct answer with one sourced statistic under each H2 raises the URL citation rate of comparison pages on Perplexity and ChatGPT by at least 10 points versus control within the test window. |
| Candidate pages | 40 comparison pages on one template, sorted by baseline citation rate, alternately assigned: 20 test, 20 control |
| Prompts | 3 buyer-style prompts per page (120 per group), screened in baseline: drop any cited in every run or retrieved in none, replace from a reserve list |
| Engines | Perplexity and ChatGPT as primary (sized separately); Gemini and Claude logged as secondary |
| Runs | 2 per prompt per engine per week, so about 960 observations per group per engine per 4-week period |
| Timeline | Weeks 1-4 baseline, week 5 ship and washout (excluded), weeks 6-9 test |
| Primary metric | URL citation rate per engine, difference-in-differences (test change minus control change) |
| Guardrails | Google organic clicks (Search Console), AI-feature impressions (Generative AI report), AI referral sessions |
| Decision rule | Ship to all comparison pages if the effect is at least 10 points on an engine, positive on most test pages, and holds without the top page; otherwise inconclusive, iterate |
| Frozen during test | Templates, internal links, titles and dates on all 40 pages; no PR push on these topics |
At a 30% baseline citation rate, 960 observations per group gives an independent-case MDE of about 8 points, so a 10-point target is reachable, though correlation between runs of the same prompt eats some of that margin. It is a real cost: about 7,680 engine runs for the two primary engines over the two periods. If that is too much, cut to one engine, not to fewer prompts.
How do you know if a GEO experiment result is real?
A result is credible when it clears the effect size you set in advance, shows up across most test pages rather than one, holds on more than a single engine or is explained per engine, and the control group did not move the same way. Run these checks before believing it:
- Compare against control, not against the baseline. The effect is (test after - test before) - (control after - control before). In the year-in-title test, a raw +61% shrank to nothing next to a reference page that rose 63-64%.
- Check concentration. Recompute the result without the single largest page. Otterly did this in both experiments: the publication-date effect held at +30.4% across the other nine articles, while the year-in-title effect fell to about +12.5% once one URL was removed.
- Count pages, not just totals. "7 of 10 test pages gained" is more informative than "+31.5%".
- Read each engine separately. An aggregate gain can hide a loss on the engine you care most about.
- Check the pre-period. If test pages were already trending up before the change, the effect is overstated. Otterly flagged exactly this in its own publication-date test.
- Look at the guardrails. An AI win that costs Google organic traffic, as in the Omio example, may be a net loss.
- Replicate or revert. The strongest evidence is a second wave on new pages, or reverting the change and watching the effect disappear.
Then label the result honestly: positive, negative, or inconclusive. SearchPilot's view that "an inconclusive result is not a failure" is the right one. It tells you the effect, if any, is smaller than your test could see.
Which GEO experiments are worth running first?
Start with changes that are cheap to apply across many pages and plausible given how retrieval works, and use other teams' published results as hypotheses, not answers. These ideas come from published tests; the results are the publishers' own and carry the caveats above:
- Genuine content refresh versus date-only refresh. Otterly's date-only change was followed by +31.5% citations (10 pages vs 2 controls, directional). The more useful test is whether a real update beats a date bump. See our guide to content freshness and AI citations for what to change.
- Answer-first summary blocks. OnBoard's key-takeaways block (via Peec) and Omio's structured takeaways (via SearchPilot) both lifted AI metrics, but Omio's also looked likely to hurt Google traffic. Test it with a Google guardrail.
- Brand facts and USP modules. Omio's USP module lifted LLM sessions by 18% with an inconclusive Google effect.
- Publishing original statistics. Peec's Metehan Yesilyurt describes publishing his own statistics as "the tactic that put my data all over the web". Because the effect spreads across other sites, run it as a topic-cluster test, not a page test.
- Schema markup, Markdown versions, llms.txt. Otterly has published experiments on each. Note that Google's guide to generative AI features says structured data "isn't required for generative AI search" and that Google Search does not use AI text files, so test these on the non-Google engines where the question is open.
- Where facts live on the page. Otterly found that facts placed only in image filenames, alt text or captions were not picked up across five AI platforms. Test moving key facts into body text.
Skip anything that only works by tricking an engine. Hidden text has long been a search spam tactic, and Otterly's Reddit test ended when Reddit removed all four communities built for the experiment, citing a content policy violation. Some tactics carry costs no citation gain covers.
Tools that can run GEO experiments
No tool removes the need for a control group, and only some help you build one. Disclosure: AI Rank Lab is our product. We list it first because this is our site, and we've kept the same criteria for every tool below.
| Tool | What it does for an experiment | Control-group support | Where it is the better choice |
|---|---|---|---|
| AI Rank Lab | Runs the prompts you choose on ChatGPT, Claude, Gemini, Perplexity, AI Overviews and AI Mode and stores every run; the Action Plan citation tracker re-checks opted-in prompts weekly; AI bot tracking and GA4 for the referral guardrail | No built-in split-test analysis; you keep separate test and control prompt lists and compare their stored runs yourself | One place for repeated multi-engine runs plus traffic guardrails |
| SearchPilot | Page-group split testing measuring LLM referral traffic and Google organic together | Yes, statistically bucketed control and variant groups | Large template sites that want business-outcome proof |
| LLM Pulse | GEO Testing feature with time-based and split tests on URL groups | Yes, split tests with a control group (Scale plan or higher) | Teams that want the test set-up built into the tracker |
| Otterly AI | Citation and prompt tracking used for Otterly's own public experiments | Manual | Following and replicating Otterly's published test designs |
| Peec AI | Citation rate and retrieval metrics per page and domain | Manual | Separating "retrieved" from "cited" in content tests |
| Google Search Console | Generative AI report impressions per page and date | Manual (sum by page group) | Free, first-party data for AI Overviews and AI Mode |
Features checked October 2026 on each vendor's public pages. Tool features change often; confirm on the vendor's site before buying.
Limitations of this guide
Our variance baseline comes from 42 prompt-engine pairs chosen by AI Rank Lab users, not a random sample of prompts, with uneven run timing and unpinned model versions; Perplexity and AI Overviews are thinly represented. The sample-size table assumes independent observations and so understates what you need. The published experiments we summarize are vendor-run, and we report their numbers as published without access to their raw data. None of this changes the core rule: without a control and repeated measurement, a GEO experiment cannot tell a real effect from the engines' everyday drift.
If you want to run your first controlled test, set up your prompt set in AI Rank Lab and record a two-week baseline before you change anything.
Get a free AI ranking consultation
Want your brand to show up when ChatGPT, Gemini and Perplexity answer questions in your market? Tell us about your site and our team will send a personalized strategy.


